The D.A.T.a Project
Description: The D.A.T.A project was a project that the entire Jill/Nicole team did. The project required the students to make an infographic about a certain topic of their choice. The class came up with five questions to put on a giant survey for the entire Jill/Nicole team to take. After the survey was taken, the data was given back to the students that made up the questions and they used them on there first draft. When the students turned in there first draft, there was revision and then the students turned in there final draft to be exhibited at the first freshman exhibition.
My infographic: For my infographic, I chose to do video games since it is a very interesting topic to me. I recorded my data by placing the five questions that I set for people to answer in a giant survey that the entire Jill/Nicole took and answered all of my questions. Then I took my data and put it into several graph to display on my infographic. For my infographic design, I chose to have a large Xbox One controller for the background and I put the pie charts that I made and used them as the analog sticks. When the class was finished with the project, we displayed them at freshman exhibition.
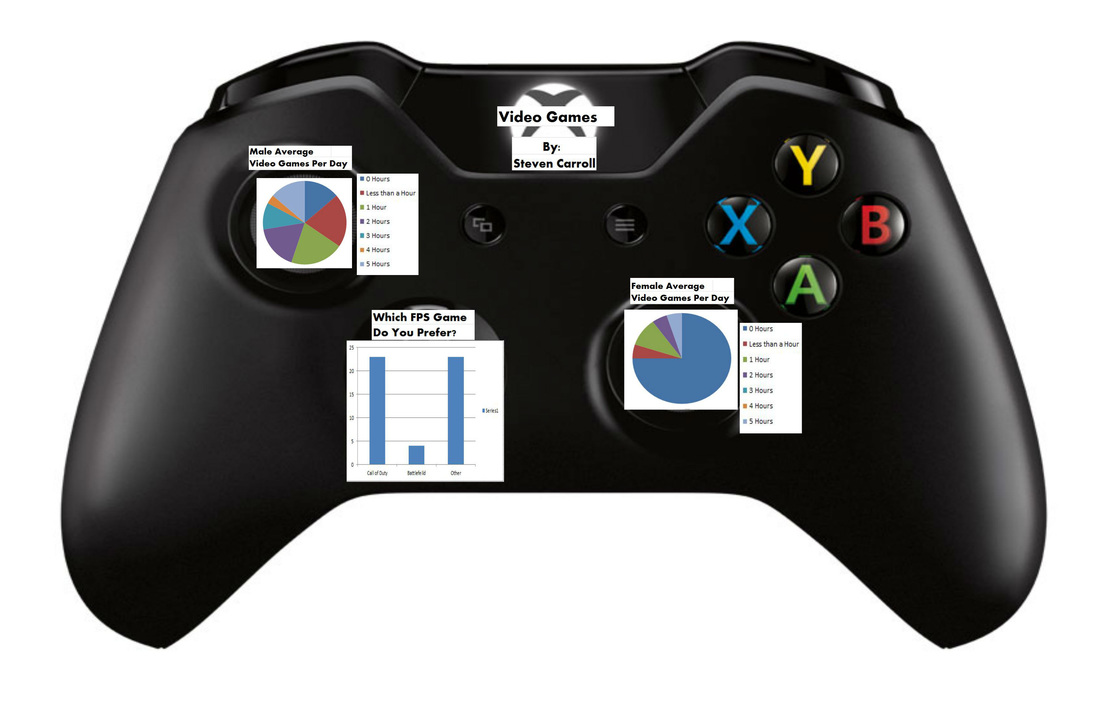
What I learned: I learned that boys on average play more video games than girls and that Call of Duty is a more popular FPS (first person shooter) than Battlefield is. I also learned that making an infographic is harder than it looks and it takes alot of work and creative thinking.
